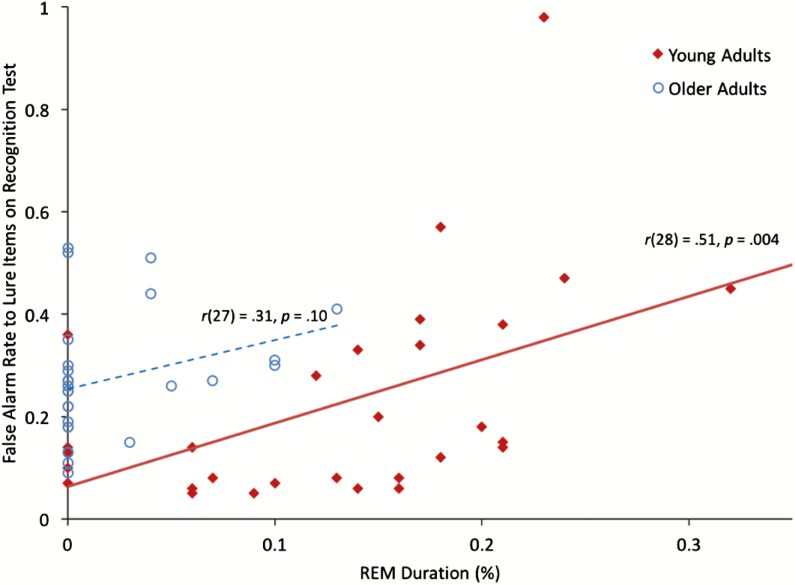
Figure 3.
Scatterplot illustrating relationship between REM percent and false alarm rate to lure items (proportion out of 100 possible) on the recognition test in young adults. The older adult data are provided for archival purposes. Note that after removing the outlier young adult data point (at top of graph), the correlation between REM percent and false alarm rate was still significant, r(27) = .51, p = .005. REM = rapid eye movement.

