Figure 1.

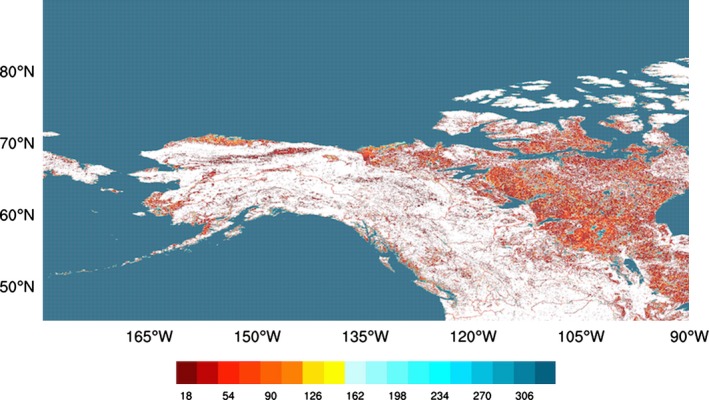
A portion of the global LC CCI water‐bodies map represented at 1/20∘ resolution. The colour shows the number of 1/360∘×1/360∘ cells identified as water per 1/20∘×1/20∘ latitude–longitude grid box, with a maximum value of 18×18 = 324.

A portion of the global LC CCI water‐bodies map represented at 1/20∘ resolution. The colour shows the number of 1/360∘×1/360∘ cells identified as water per 1/20∘×1/20∘ latitude–longitude grid box, with a maximum value of 18×18 = 324.