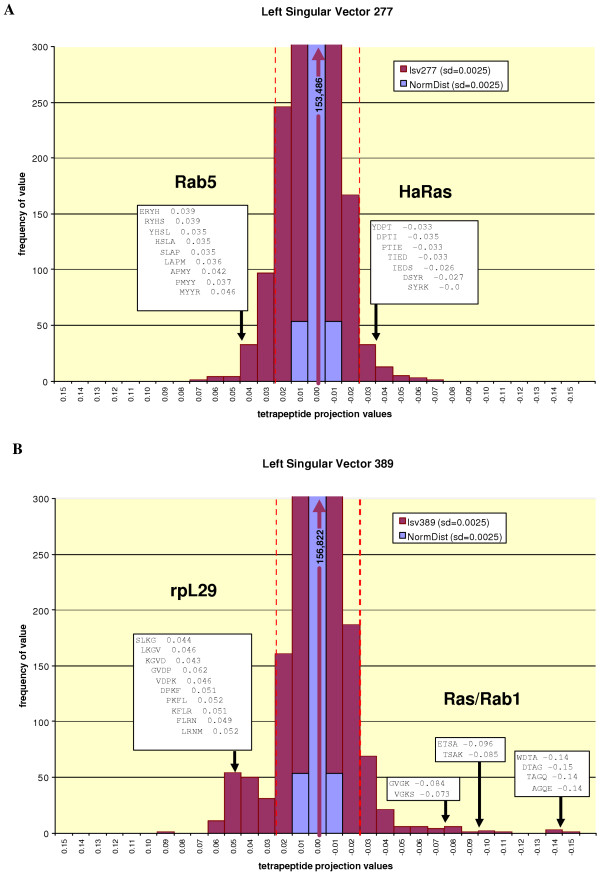
Figure 2.
Left singular vectors depicted as tetrapeptide projection value frequency distributions. Distributions for singular vectors 277 (A) and 389 (B) are shown in purple, normal distributions having the same standard deviation are shown in blue. For both distributions, the vast majority of values fall between 0.015 and -0.015. Dashed lines mark the cut-off values used to extract dominant tetrapeptides summarizing correlated peptide (copep) motifs. Selected strings of overlapping tetrapeptides describing parts of these motifs are shown boxed above the approximate regions in the distribution in which they appear.

