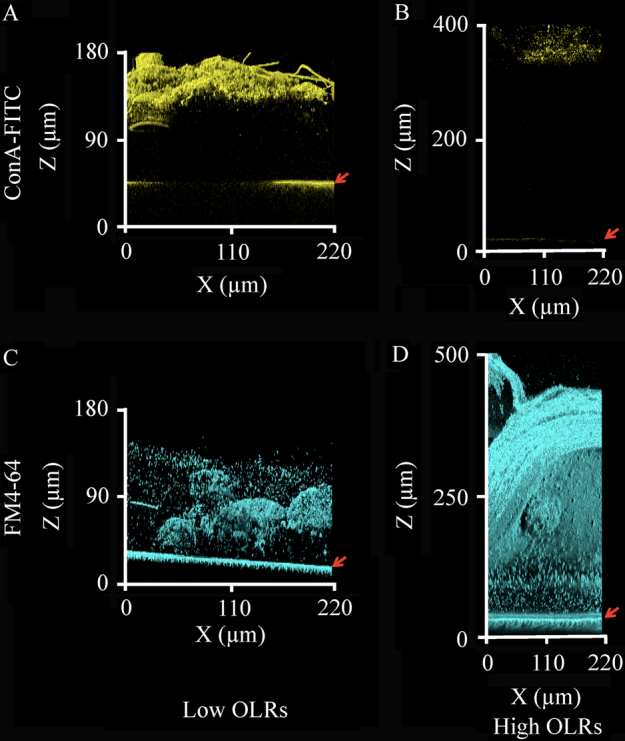
Fig. 2.

Chemical components of the fouling-related biofilms. The yellow color indicates polysaccharides probed by ConA-FITC, and the cyan color indicates the cell membrane-derived lipids stained by FM4-64. The positions of the membrane surfaces are indicated by the red arrows. Fluorescent images were obtained from the 31 kPa TMP biofilms under the low OLR conditions (a, c) and 50 kPa TMP biofilms under the high OLR conditions (b, d). The microscopic observations were performed on at least five different points of the fouled membranes, and the representative images are shown for presentation
