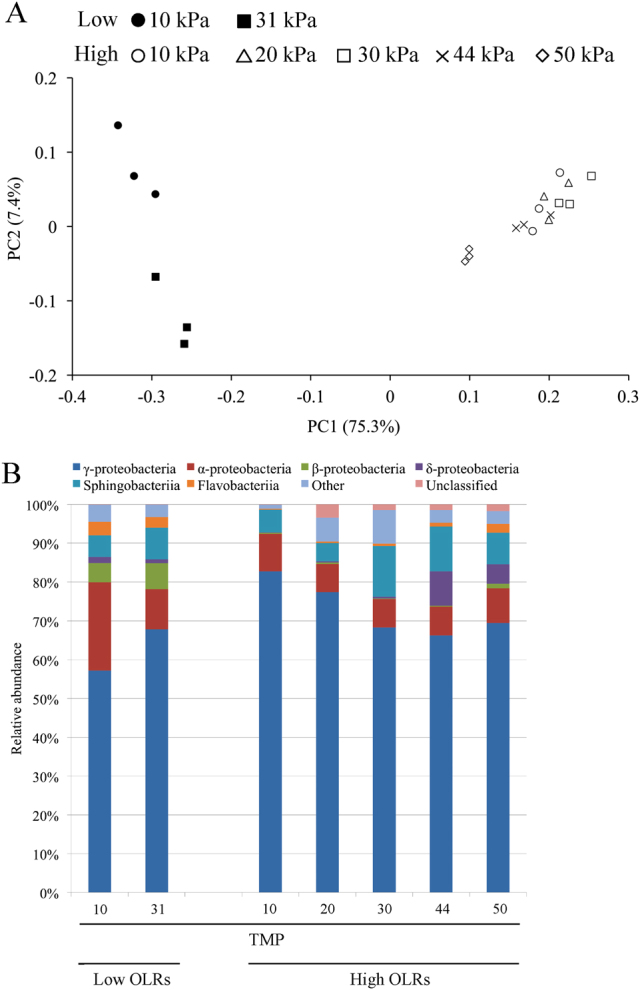
Fig. 3.

Comparison of the biofilm microbiomes at different extents of the membrane fouling. a Principal coordinate analysis (PCoA) scatter plot of 16S rRNA genes obtained from Illumina sequencing. The weighted UniFrac distances were calculated based on an equal number (n = 7114) of sequences. Closed and open circles indicate the low and high OLR conditions, respectively. The symbol type indicates the TMP value. b Class-level distribution of the fouling-related biofilm microbiomes. The relative abundances of each bacterial class are shown
