
Fig. 5.
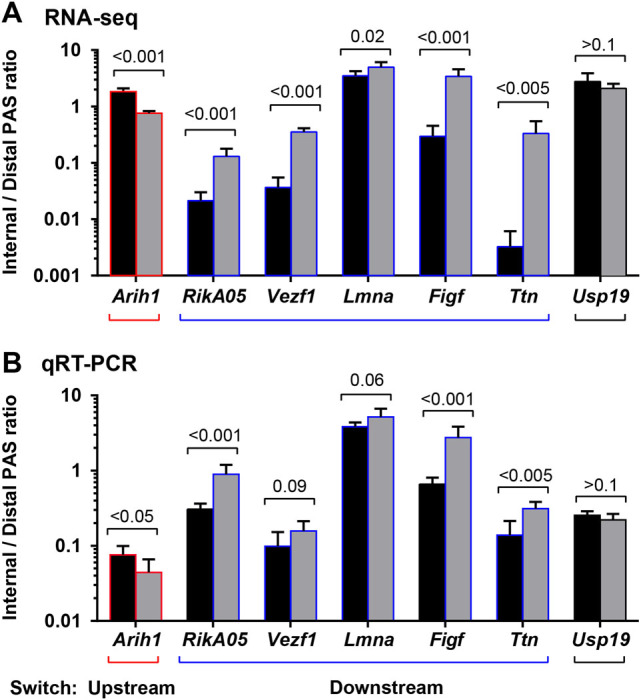
PAS switch between regions in quadriceps and tibialis anterior muscles. a Bar chart shows the ratio between distal to internal PAS obtained from read counts from polyA-sequencing in quadriceps muscle. Expression values were obtained after TMM normalization. Averages and SD are from six mice. b Bar chart shows the ratio between distal to internal PAS obtained from qRT-PCR analysis in tibialis anterior muscle. Averages and SD are from six mice. p-values for the differences between A17.1 and WT tibialis anterior muscles were assessed with the Student’s t-test. Red outlines depict a downstream switch, and blue outlines an upstream switch