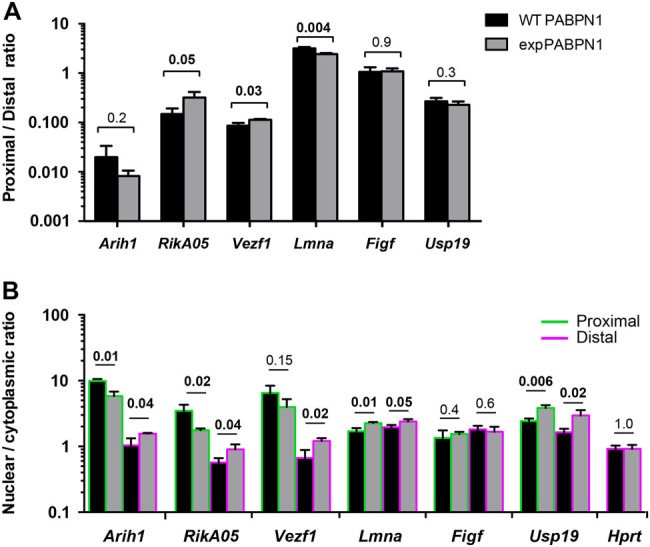
Fig. 6.

The effect of expPABPN1 on PAS utilization in muscle cell culture. a Bar chart shows the ratio between distal and internal PAS from qRT-PCR analysis. Red outlines are depicted for a downstream switch, and blue outlines for an upstream switch and unchanged by a black line. b Bar chart shows changes in transcript abundance between nuclear and cytoplasmic fractions. Primer set amplifying intronic regions are depicted by green outlines and from primer set in the distal 3′-UTR by purple outlines. Averages and SD are from three biological replicates. Differences between WT-PABPN1 and expPABPN1 cultures were assessed with the Student’s t-test. Significant p-values are in bold
