
Figure 2.
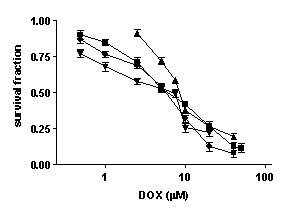
Dose-response curves of HCT116 (■), HT29 (▲), HCT116E6 (▼), and HCT116 p21-/- (●) cells after 1 hour exposure to DOX followed by 72 h incubation in drug free medium (mean ± s.e.m. of 4–6 experiments).
Official websites use .gov
A
.gov website belongs to an official
government organization in the United States.
Secure .gov websites use HTTPS
A lock (
) or https:// means you've safely
connected to the .gov website. Share sensitive
information only on official, secure websites.
Dose-response curves of HCT116 (■), HT29 (▲), HCT116E6 (▼), and HCT116 p21-/- (●) cells after 1 hour exposure to DOX followed by 72 h incubation in drug free medium (mean ± s.e.m. of 4–6 experiments).