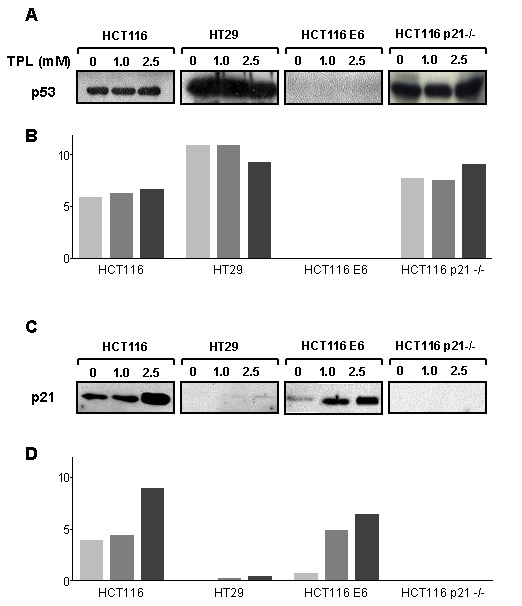
Figure 5.

p53 (A) and p21 (C) protein levels in HCT116, HT29, HCT116 E6 and HCT116 p21-/- cells following 24 h exposure to TPL. Panels B and D: densitometric analysis of p53 and p21-immune reactive bands, respectively (white bars: untreated; light grey bars: TPL 1.0 mM; dark grey bars: TPL 2.5 mM).
