
Fig. 1.
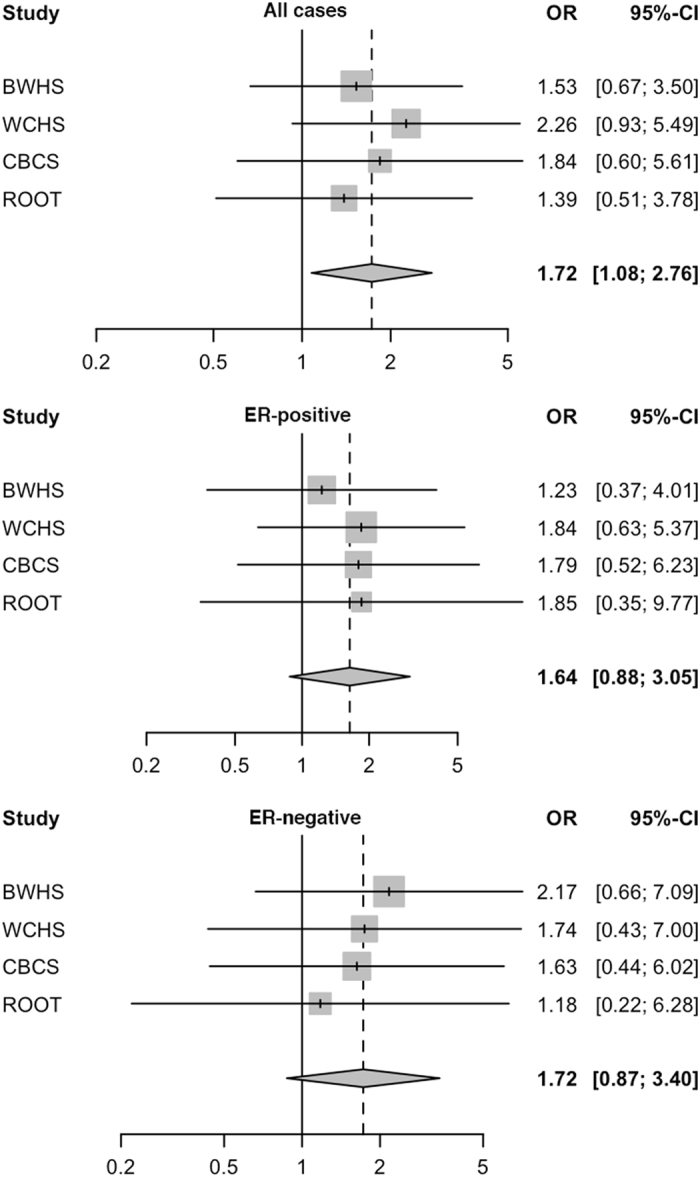
Forest plot of meta-analysis of TP53 rs1800371 with breast cancer risk among pre-menopausal women in the AMBER and ROOT consortia. Study-specific odds ratios (OR) from each of BWHS, WCHS, CBCS, and ROOT is indicated as a shaded square, with 95% confidence interval (CI) shown as a horizontal line. The meta-OR is indicated as a diamond, with the width corresponding to the 95% CI. The analyses were performed for all cases, ER-positive cancer, and ER-negative cancer