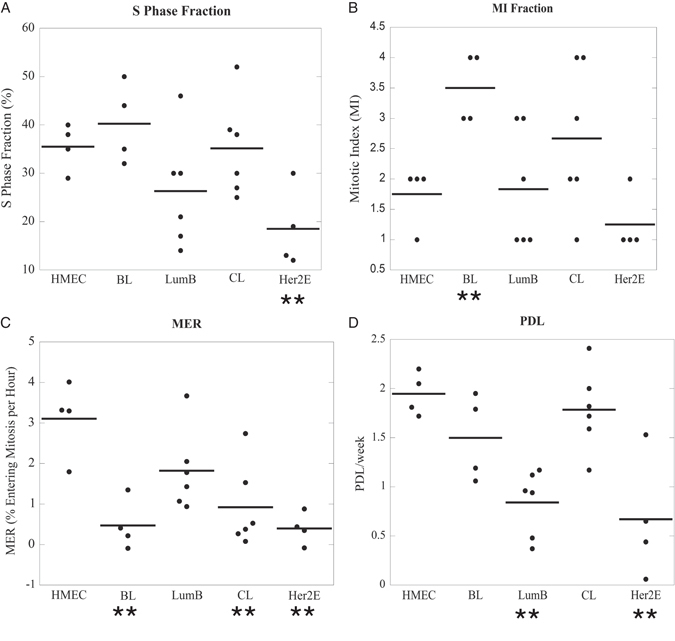
Fig. 3.

S/G2/M progression is aberrantly regulated in breast cancer cell lines of all classes. The average percentage of cells in S phase (a) or mitosis (b) and the MER (c) is shown for each cell line and grouped according to intrinsic molecular subtype. Each point represents the average of at least three independent experiments for an individual cell line, and the bold lines represent the class average. The Her2E class exhibited a lower S phase fraction, the BL class demonstrated a higher MI, and the BL, CL, and Her2E classes displayed lower MERs when compared to the HMEC class. d The population doubling level (PDL) over at least 11 weeks in cell culture was determined for each cell line, and the bold lines represent the class averages; both the LumB and Her2E classes exhibited low PDLs. *p-value < 0.05, **p-value that remains significant when controlling for false discovery rate (5%)
