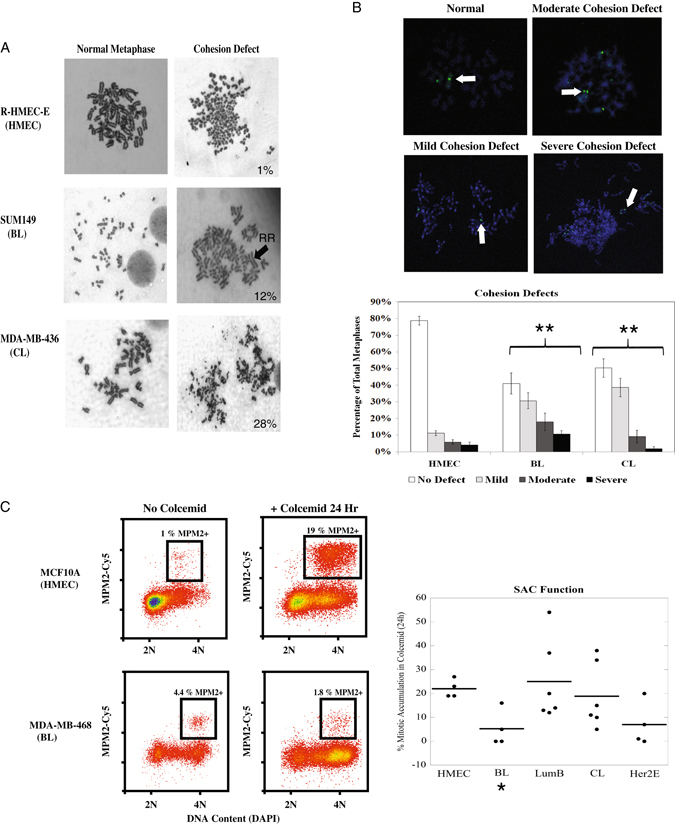
Fig. 4.

The BL and CL cell line classes exhibit chromatid cohesion defects; the BL class also harbors a defective SAC. a Examples of cohesion defects observed in metaphase. The percentages of cells containing cohesion defects is shown for each cell line in the lower right corner of the cohesion defect picture. A “railroad” (RR) chromosome lacking a centromeric constriction point is designated with a black arrow in the SUM149 cell line to exemplify a mild cohesion defect. A severe cohesion defect is exemplified by the complete discohesion of the MDA-MB-436 metaphase. b Representative examples of the severity of cohesion defects observed during FISH analysis (upper panels). White arrows designate the centromere used for cohesion defect classification. Quantification of cohesion defects (lower panel) demonstrate that both the BL and CL classes exhibited variation in the distribution of chromatid cohesion defect severity when compared to the HMECs. Results shown were obtained from at least four different biological replicates for each subtype. c Flow cytometry examples reflecting SAC function in an HMEC line (MCF10A) and a BL breast cancer line (MDA-MB-468). Individual cell line averages obtained from at least three independent experiments are shown with bold lines representing the class average; the BL class exhibited a decrease in SAC function (right panel). *p-value < 0.05, **p-value that remains significant when controlling for false discovery rate (5%)
