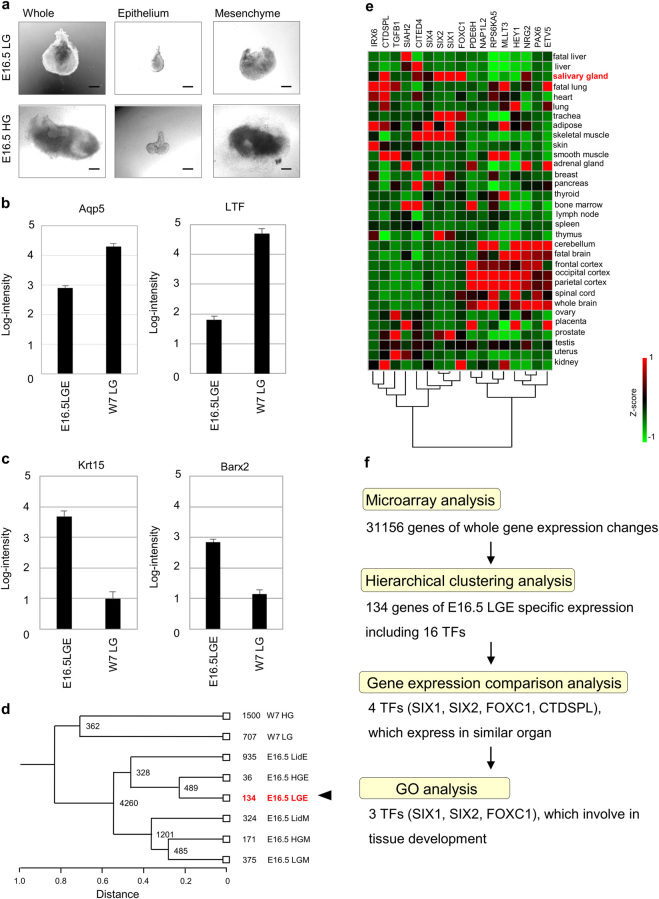
Fig. 1.
Identification of tissue specific TFs for LGE. a Phase-contrast microscopic images of E16.5 mouse lacrimal gland (upper) and harderian gland (lower). Images of whole (left), separated epithelium (center), and separated mesenchyme (right) are shown. Scale bar 100 µm. b The gene expression comparison of mature LGE markers in the microarray analysis between E16.5 LGE and W7 LG. E16.5 embryonic day 16.5, LGE lacrimal gland epithelium, W7 LG 7-week-old mouse lacrimal gland. c The gene expression comparison of LGE markers in the microarray analysis between E16.5 LGE and W7 LG. E16.5 embryonic day 16.5, LGE lacrimal gland epithelium, W7 LG 7-week-old mouse lacrimal gland. d Hierarchical clustering analysis. The number of specific genes is shown. W7 LG 7-week-old mouse lacrimal gland, W7 HG 7-week-old mouse harderian gland, E16.5 embryonic day 16.5, LGE lacrimal gland epithelium, LGM lacrimal gland mesenchyme, HGE harderian gland epithelium, HGM harderian gland mesenchyme, LidE eyelid conjunctiva epithelium, LidM eyelid conjunctive mesenchyme. e Gene expression profiles of 16 TFs among 134 genes and PAX6 analyzed by web database tool. Foxc1, Six1, Six2, and Ctdspl express highly also in salivary glands, which are secretory glands similar to the lacrimal glands. Heat map (Green to red) represents a Z-score among organs. f Flowchart of an approach to identify premature lacrimal gland epithelium specific transcription factors

