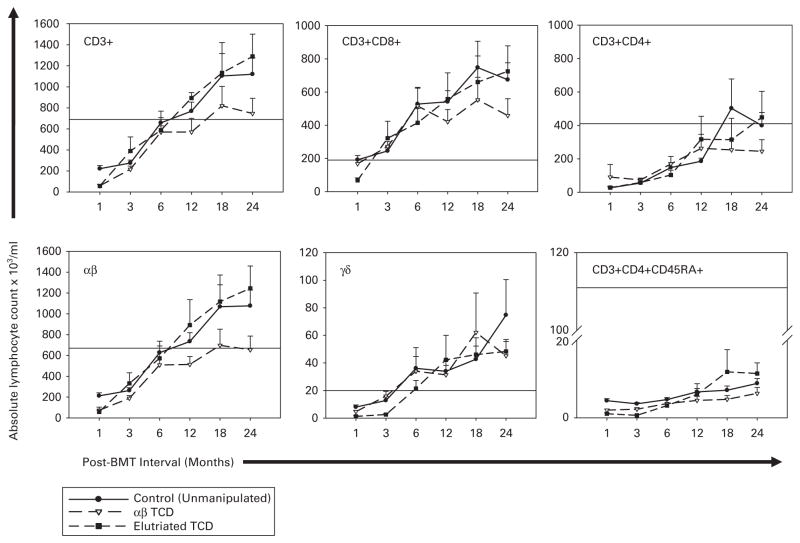
Figure 1.
T-lymphocyte recovery over 2 years for patients who received unmodified marrow grafts (solid lines and filled circles) vs patients who received grafts depleted of αβ +T cells using T10B9-A1.31 +complement (dashed lines and open triangles) or grafts processed by elutriation (dashed lines and filled squares). Shown are total T cells (CD3), major subsets (CD3 +CD4 +, CD3 +CD8 +, TCR-αβ, TCR-γδ) and naive CD4 + T cells (CD3 +CD4 +CD45RA +). Horizontal lines designate lower normal values. The upper normal range was not exceeded and is omitted to allow more detail for the plots. Mean TCR-αβ and CD3 +CD4 +CD45RA + T-cell counts were consistently higher in the elutriated group but not so significant. Indeed, with the exception of αβ T-cell numbers at 24 months post-BMT, no group showed statistically superior T-cell or T cell subset recovery at any time point.

