
Fig. (3).
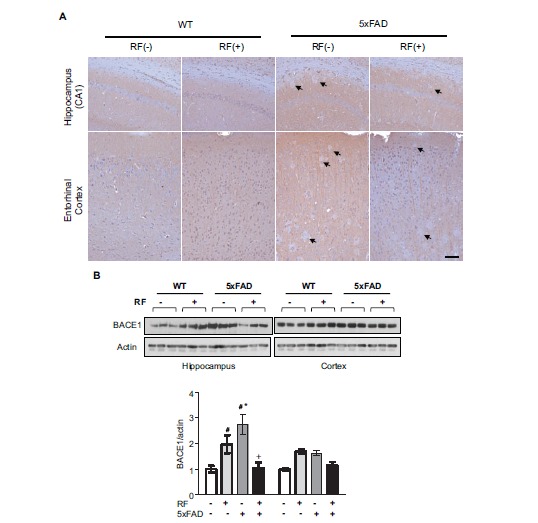
RF-EMF modulates BACE1 expression. A. Immunohistochemistry analysis of BACE1 expression in brain sections following chronic RF-EMF exposed Tg-5xFAD and WT mice. Arrow indicates BACE negative Aβ plaques. Scale bar: 100μm. B. Western blotting of BACE1 in the hippocampus and cortex extract in Tg-5xFAD and WT mice following RF-EMF exposure. Values are presented as the mean ± SEM and analyzed by ANOVA (analysis of variance) and Bonferroni post-hoc test (# p < 0.05 vs. WT-RF(-), * p < 0.05 vs. WT-RF (+), + p < 0.05 vs. Tg-5xFAD-RF (-)).