
Fig. (6).
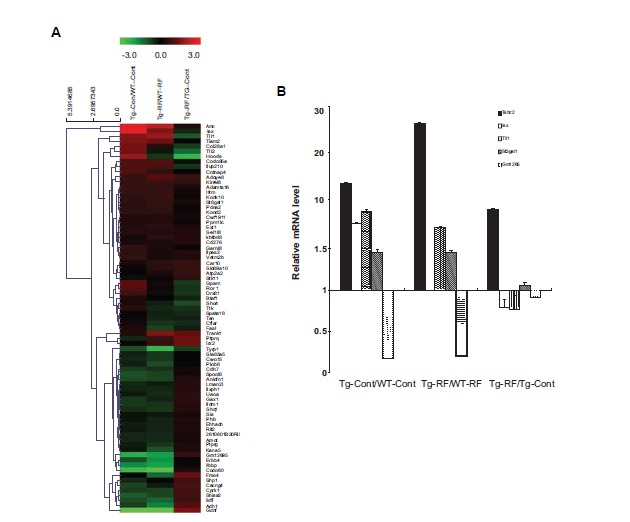
Altered psychology-related gene expression following RF-EMF. A. A Cluster heat map of genes whose expression was significantly altered in the hippocampus of WT and Tg-5xFAD mice with or without RF-EMF exposure. In the heat map, green represents a lower expression level and red indicates a higher expression level. B. A qRT-PCR for 5 genes was performed using 3 different hippocampus samples from WT and Tg-5xFAD mice with or without RF-EMF exposure. Values are presented as the mean ± SEM and analyzed by ANOVA (analysis of variance) and Bonferroni post-hoc test.