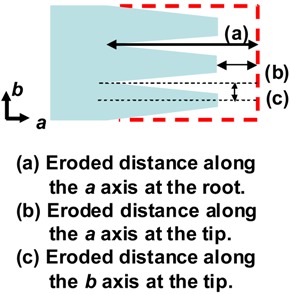
Table 1.
Partial and overall erosion rates along the a and b axes at the tip and root of the fibril-like crystals during enzymatic degradation [57]. Reproduced with permission from Numata et al., Biomacromolecules; published by ACS, 2005.
| Root | Tip | |||
| a axis | a axis | b axis | ||
| b H-P(3HB) | 3.7 | 2.6 | 1.3 | 0.0007 |
| M-P(3HB) | 8.3 | 3.8 | 1.3 | 0.0015 |
| L-P(3HB) | 10.6 | 3.2 | 1.1 | 0.0018 |
| P(3HB-co-6mol%-3HV) | 12.4 | 6.8 | 2.0 | 0.0026 |
a Erosion rates were determined from real-time AFM observation as shown in Figure 6. b H-P(3HB), M-P(3HB) and L-P(3HB) mean high-molecular-weight (Mn:240,000), middle-molecular-weight (Mn:55,000) and low-molecular-weight P(3HB) (Mn:8,500), respectively.

