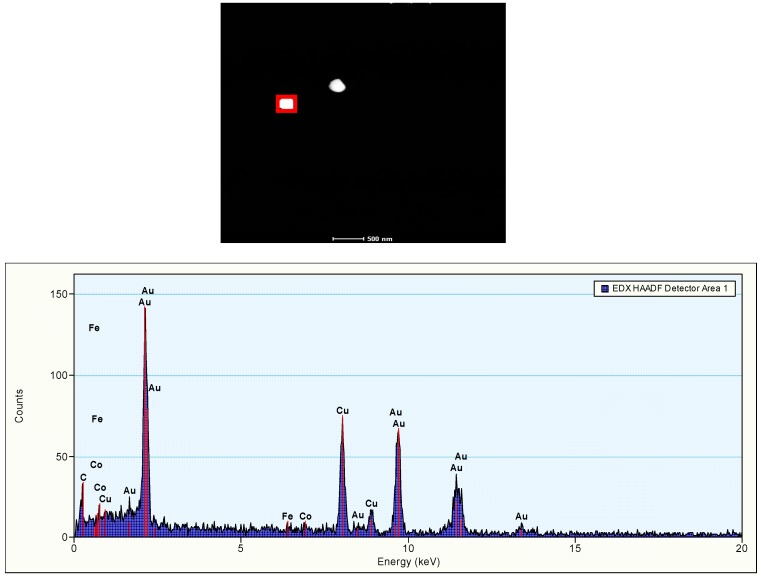
Figure 2.
The presence of 250 nm gold nanoparticles in solution. Top: HAADF-STEM image depicting two Au-particles. The red rectangle indicates the region that was scanned during EDX acquisition. Bottom: EDX analysis of single 250 nm gold nanoparticle as present in the solution administered to the animals. In the graph the acquired spectrum of the marked area is presented. It is clearly visible that the particle consists of Au. The other signals in the spectrum can be explained: C, Cu: from the support grid and film, Fe, Co: from the lenses of the microscope.

