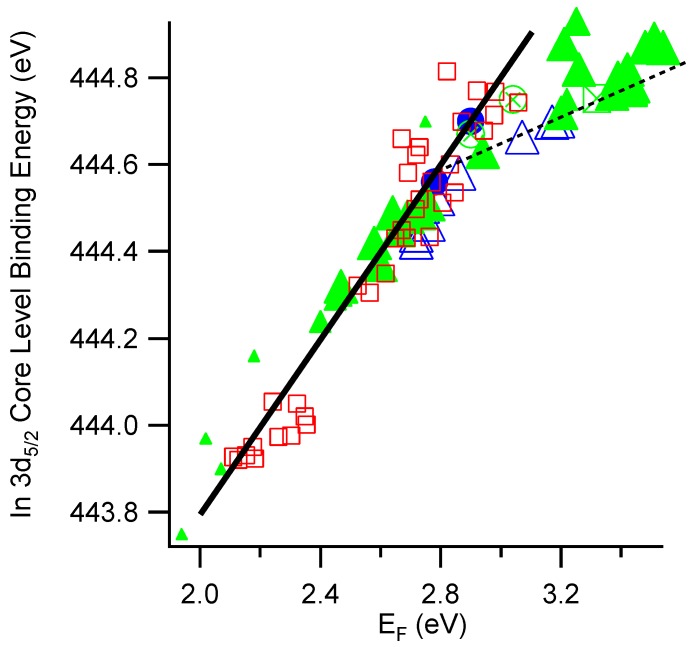
Figure 3.
In 3d5/2 core level binding energy vs. Fermi level position for InO and ITO. The solid line marks a slope of one. Squares represent InO films and sintered ceramic samples, solid circles represent sintered ceramic ITO, solid triangles represent 10% doped ITO films, open triangles represent 2% doped ITO films, cross circles represent air-annealed ITO films (at C), and crossed squares represent ozone treated ITO films. Symbol size reflects the substrate temperature during deposition, which ranges from room temperature (small) to C (large).

