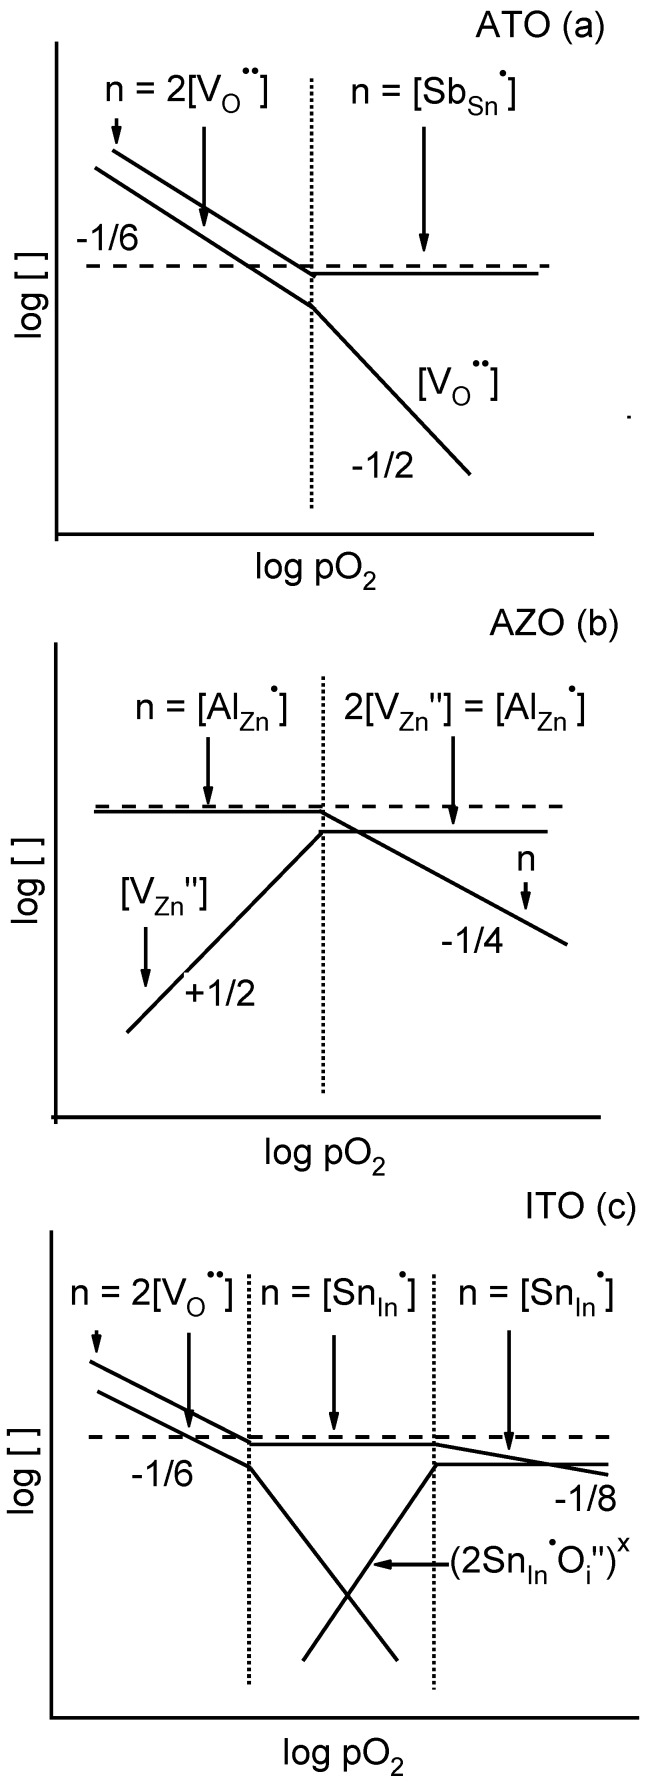
Figure 4.
Schematic Brouwer diagrams (log concentration versus log pO) for (a) SnO:Sb (ATO), (b) ZnO:Al (AZO), and (c) InO:Sn (ITO). Vertical dotted lines separate different electroneutrality regimes, as denoted at the top of each column. Fractions indicate line slopes. Concentrations of electrons (n), doubly charged O vacancies (), doubly charged Zn vacancies (), Sb donors (), Al donors (), Sn donors (), and Frank-Köstlin defects () are shown where relevant.

