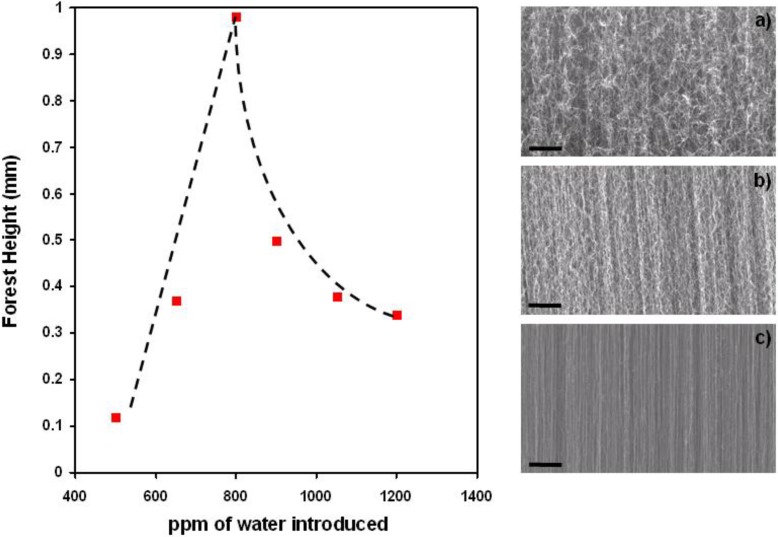
Figure 4.
The height of the resulting carbon nanotubes forests strongly varies with the ppm of water introduced into the reactor. The SEM micrographs obtained at (a) 500 ppm, (b) 800 ppm and (c) 1,200 ppm, illustrate that the carbon nanotubes alignment, as well as their density, significantly changes with the amount of added water. Whereas the thickest carpet is produced at 800 ppm, the best alignment is obtained at 1,200 ppm. Dashed lines guide the eyes. Scale bars are 2 µm.

