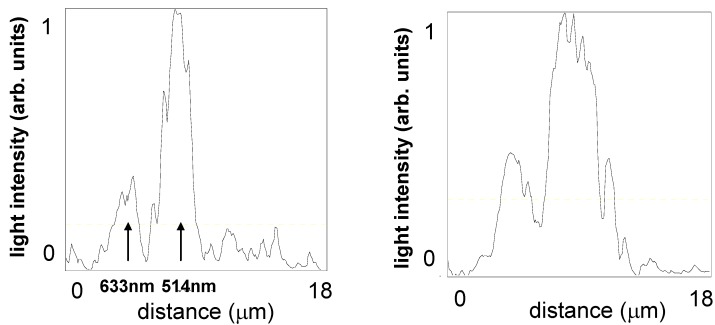
Figure 7.
Cross sections of the optical microscope images along the yellow lines shown in Figure 6. Individual spectral lines are clearly resolved in the left plot obtained using 514 nm and 633 nm illumination. Multiple spectral lines are visible in the right plot, which is obtained under multiline illumination.

