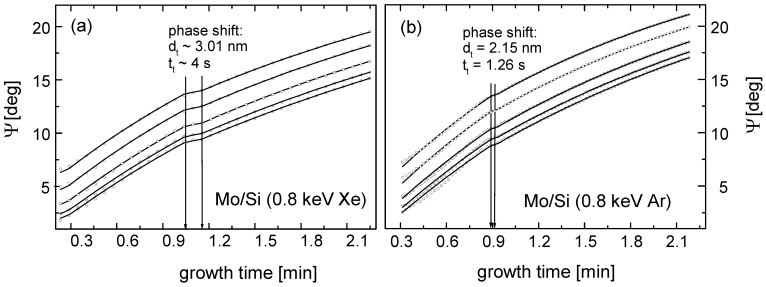
Figure 17.
Real time spectroscopic in situ ellipsometry experimental (points) and model (solid lines) spectra of Mo layer growth in the (a) Xe sputter regime (Eion = 0.8 keV, fXe = 1.6 sccm) and (b) Ar sputter regime (Eion = 0.8 keV, fAr = 3.2 sccm). The different lines refer to different wavelengths [134].

