Figure 4.
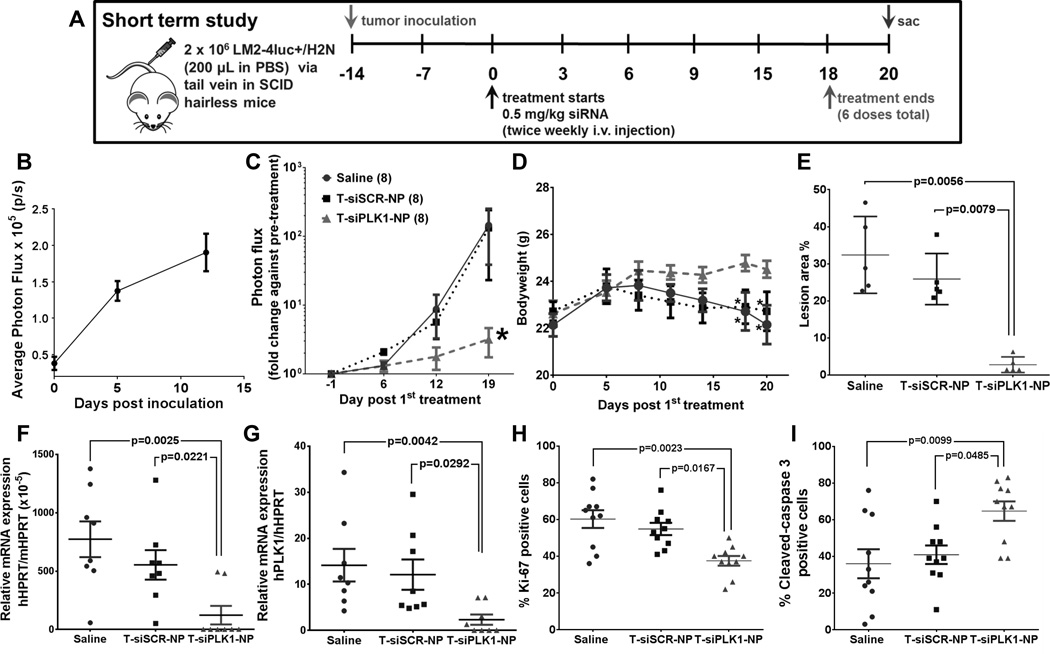
Effects of T-siPLK1-NP treatment in the in vivo experimental metastasis model. (A) Schematic representation of the study design for the short-term in vivo study. (B) Quantification of lung photon flux (by weekly IVIS) showing cancer being established in lungs post inoculation. (C) The lung photon flux normalized to pre-treatment flux from each individual mouse in the same treatment groups. (D) Average body weight of mice in each treatment groups during the study period. Tumor burden in lungs as quantified by (E) percent tumor lesion area per total lung area (see Supplementary Fig. S6A for images) and by (F) qPCR analysis of human HPRT (hHPRT) mRNA relative to mouse HPRT (mHPRT) in mouse lungs. (G) Knock down of PLK1 mRNA, quantified by hPLK1 mRNA expression in the lung tissues relative to hHPRT mRNA. h stands for human. (H) Percent Ki-67 positive cells in the lung nodes (see Supplementary Fig. S6B for images). (F) Percent cleaved-caspase 3 (CC3) positive cells in the lung nodes (see Supplementary Fig. S6C for images). All data are represented as average ± SEM (n = 24 for (B) and n = 8/group for (C&D). Each dot in (E–G) represents value from one mouse, and in (H&I) represents one tumor node in the lungs of mice (n=2 nodes/mouse, 5 mice/group). Data are presented as mean ± SEM (n=24 for (B) and n=8/group for (C&D)). *p<0.05 from Two-way ANOVA followed by Dunnett’s multiple comparison tests for (C&D). P values as indicated on (E-I) from Kruskal-Wallis test.

