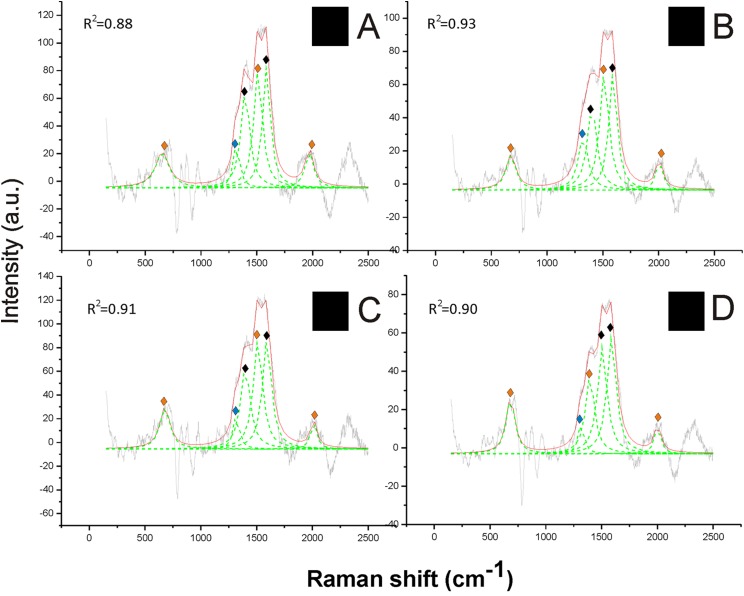
Figure 2. Examples of Raman spectra of black hair in Bombus and peak identification after having applied the reference deconvolution method.
The gray line represents the Raman spectrum, the dashed green lines represent the single deconvoluted curves, which highlight the different peaks contributing to the spectrum, and the red line represents the sum of the deconvoluted curves (i.e., the adjustment to the spectrum, whose goodness of fit expressed as R2 value). ♦ Signature peaks for eumelanin,  signature peaks for pheomelanin,
  signature peaks for chitin. (A) Thorax of Bombus lucorum; (B) thorax of Bombus monticola; (C) abdomen of Bombus soroeensis; (D) thorax of Bombus terrestris.

