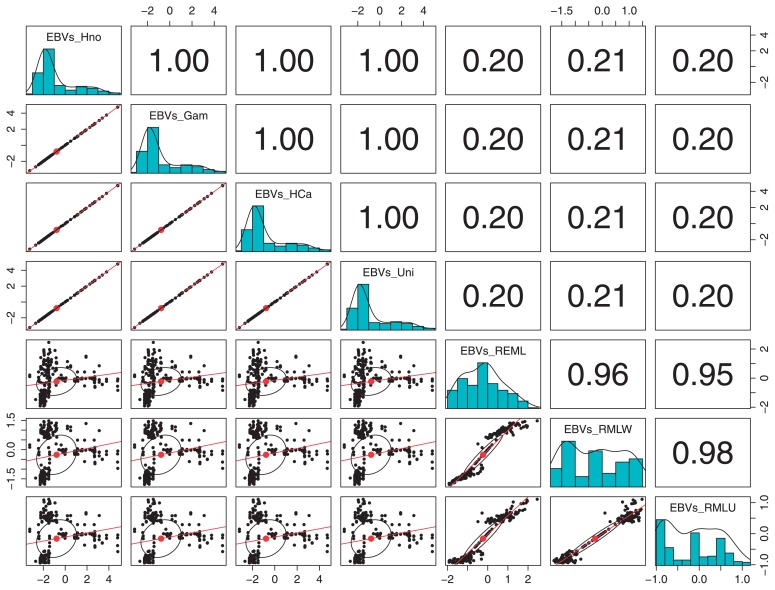
Fig. 4.
Scatter plot of matrices (SPLOM) showing the correlation of EBVs calculated through BOAM for each prior and through REML. Scatter plots below the diagonal show the linear regression that fits for the two sets of EBVs, shown on the diagonal frequency histograms, while Pearson correlation (with pairwise deletion) values are shown above the diagonal, generated though using the function pairs.panels of the package psych version 1.4.4 (Ravelle 2014) for R version 3.1.0. EBVs_HNo: EBVs calculated with an additive genetic variance with a Half-Normal-distributed prior, EBVs_Gam: EBVs calculated with an additive genetic variance with a Gamma-distributed-prior, EBVs_HCa = EBVs calculated with an additive genetic variance with a Half-Cauchy-distributed-prior and EBVs_Uni: EBVs calculated with additive genetic variance with an uniformly distributed prior, EBVs_REML: EBVs calculated through REML using a BR severity index for wounded and non-wounded fruits of Pop-BR-1 and PopBR-2, EBVs_REMW: EBVs calculated through REML using a BR severity index for wounded fruits only from PopBR-1 and PopBR-2, REMN: EBVs calculated through REML using a BR severity index for non-wounded fruits only from PopBR1 and PopBR-2.

