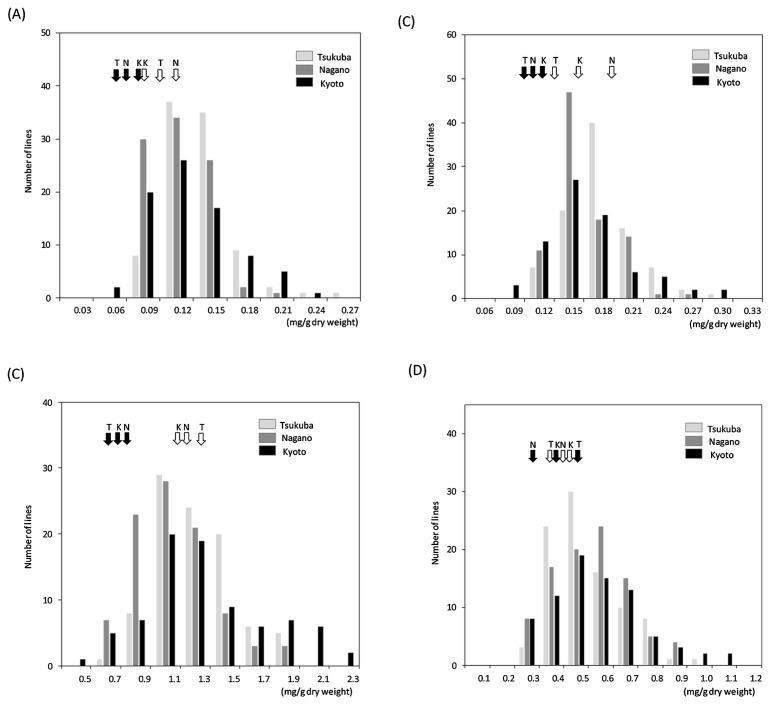
Fig. 1.
Frequency distribution of the saponin contents in PT-RILs. (A) Group A saponin contents in cotyledon, (B) Group A saponin contents in hypocotyl, (C) Group B saponin contents in cotyledon, (D) Group B saponin contents in hypocotyl. White and black arrows indicate the mean of saponin contents for ‘Peking’ and ‘Tamahomare’, respectively. ‘T’, ‘N’, and ‘K’ upside arrows indicate ‘Tsukuba’, ‘Nagano’, and ‘Kyoto’, respectively.

