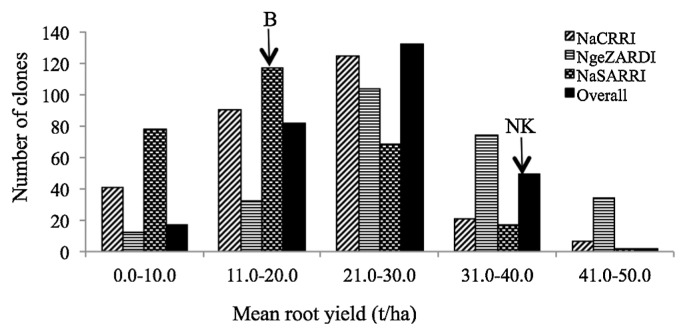
Fig. 1.
Distribution of mean storage root yield in the progeny and parents of the ‘New Kawogo’ (NK) × ‘Beauregard’ (B) mapping population, bars represent the number of clones in each class of mean storage root yield scores averaged over seasons for sites (NaCRRI, NgeZARDI and NaSARRI), and averaged over seasons and sites for the overall mean.

