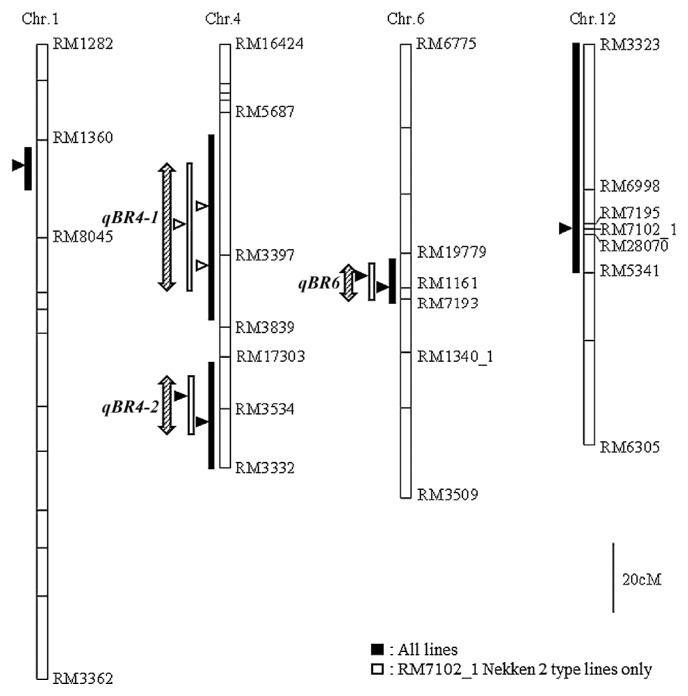
Fig. 2.
Regions where QTL associated with blast resistance exist in Hokuriku 193. Main SSR markers are shown on the right of each chromosome. Bars on the left of each chromosome indicate intervals in which the LOD threshold is exceeded and triangles indicate LOD peaks for the intervals. Dark and white triangles indicate QTL peaks at which the percentage of resistant plants decreases in the Nekken 2 type and the Hokuriku 193 type, respectively. Shaded arrows indicate regions where QTL are estimated to exist. Chromosomes where QTL were not detected are not shown.

