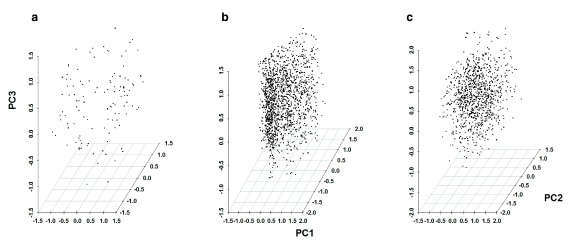
Figure 2. Plots of Principal Component Analysis scores for P. falciparum parasite populations in the study sites.
Each point represents one of 133 parasites in The Gambia ( a), 1602 parasites in Kilifi ( b) and 1034 parasites in Rachuonyo South ( c). Genetic structuring was not observed for any of the parasite populations based on these three principal components. Cumulatively, the first three principle components accounted for 36.1% (PC1=18.4%, PC2=10.4%, PC3=7.3%), 13.2% (PC1=5.1%, PC2=4.4%, PC3=3.7%) and 12.7% (PC1=4.4%, PC2=4.3%, PC3=4%) of the variability seen in The Gambia, Kilifi and Rachuonyo South populations, respectively.

