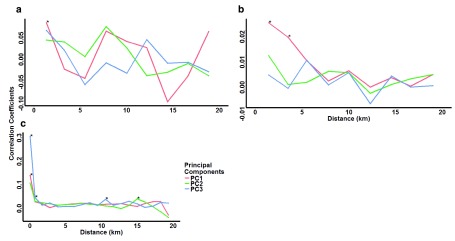
Figure 4. Moran’s I spatial autocorrelation analysis for the first three principal components.
Coefficients were computed at distance classes of 2 km for ( a) The Gambia and ( b) Kilifi, and 1 km for ( c) Rachuonyo South parasite populations. Asterisks indicate distances at which parasites have significant (p<0.01) autocorrelations. In The Gambia and Kilifi populations, only a few samples were collected from the same location, so Moran’s I was not computed at this distance (0 km).

