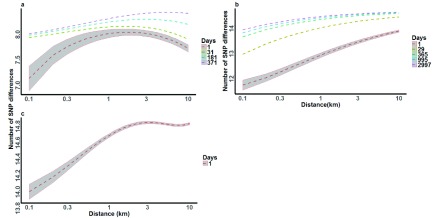
Figure 5. Effects of time-distance interaction on the number of SNP differences between parasite pairs.
Dashed lines represent time intervals separating parasite pairs in ( a) The Gambia, ( b) Kilifi and ( c) Rachuonyo South study sites. 95% confidence intervals are included around the 1-day curves in each study site. 100 pairwise analyses were used to generate the curves at each time point. 107, 177 and 82 SNPs were analysed in The Gambia, Kilifi and Rachuonyo South parasite populations, respectively. Dummy data used to generate the graphs contained 8 SNPs in the Gambia, 14 SNPs in Kilifi and 10 SNPs in Rachuonyo south.

