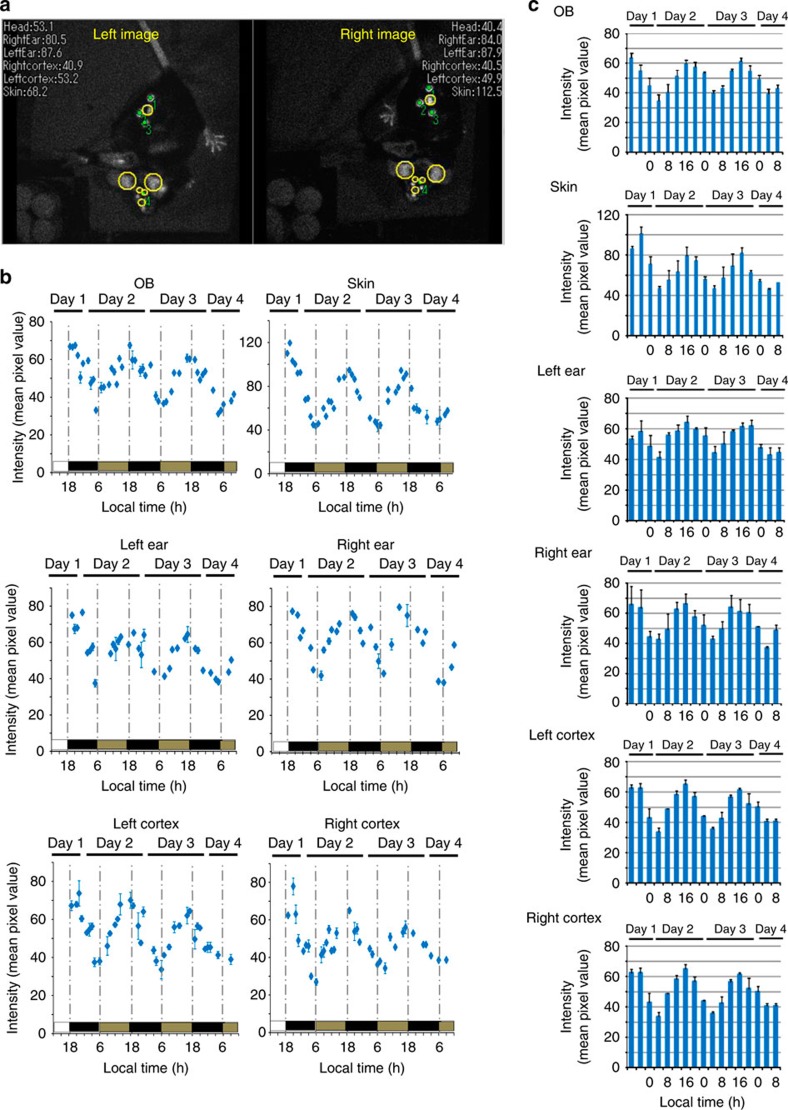
Figure 4. In vivo imaging of Per1 expression in six areas of Per1-luc transgenic mice.
Target areas (OB, skin, left ear, right ear, left cortex and right cortex) of Per1-luc (a) are automatically identified and traced. Yellow circles indicate identified areas by both EM-CCD cameras. Tracking marks and raw intensity within yellow circle areas are displayed in real time in the videos (30% correlation). To quantify the gene expression in the ROI, mismatched frames were discarded during post-processing (see the ‘Methods' section for details). Green spots in the image indicate the scintillator positions determined and numbered by the software in descending order of pattern matching score. (b) Representative Per1 expression rhythm in 6 areas of Per1-luc mice. Luciferin was supplied by an iPRECIO pump (30 μl h−1 for animals). (c) Per1 expression in six areas of Per1-luc transgenic mice. The mean bioluminescence (4 h mean±s.e.m.) in six areas (n=3̃4 animals). Per1 expression in six areas exhibited robust circadian rhythm.

