Figure 1.
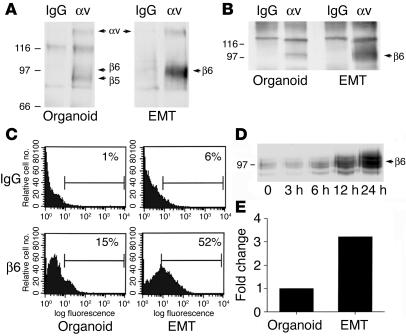
Integrin αvβ6 expression increases following EMT. (A) LIM 1863 organoids or cells harvested 24 hours after induction of EMT were surface biotinylated, and the extracts were immunoprecipitated with an mAb directed against integrin αv or control IgG. Relative molecular masses are shown to the left in kDa. Arrows indicate the positions of αv, and its associated chains β5 and β6. (B) Cell extracts were prepared from organoids or from cells 24 hours after EMT, immunoprecipitated as in A, and then immunoblotted with an mAb against the β6 integrin subunit. Relative molecular masses are shown to the left in kDa. (C) LIM 1863 organoids were either disaggregated into single-cell suspensions (Organoid) or harvested 24 hours after induction of the EMT (EMT), and surface expression of β6 was assessed by flow cytometry. A greater–than–3-fold increase in β6 surface expression occurs after the EMT. (D) Cell extracts were prepared over the time course shown after EMT induction and immunoblotted with an anti-β6 antibody to determine the kinetics of upregulation of the receptor. Relative molecular masses are shown to the left in kDa. (E) Integrin β6 mRNA levels were quantified using real-time quantitative PCR in organoid or EMT cultures of LIM 1863 cells. The fold change between treatments (3.2-fold induction following the EMT) is represented graphically.

