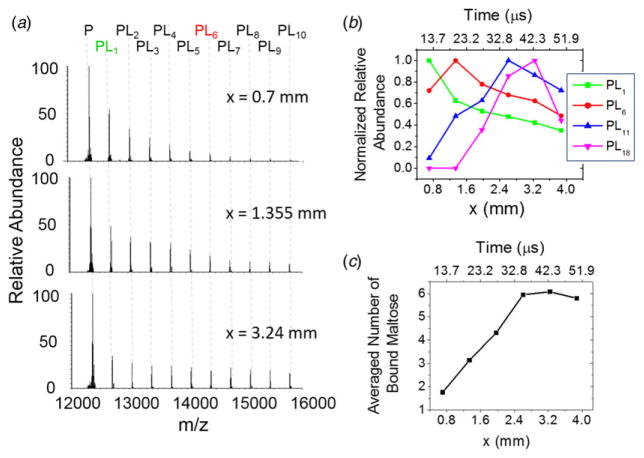
Fig. 4.
Kinetics of the binding of cytochrome c and maltose. (a) Deconvoluted mass spectra at different distances (x) with cytochrome c (100 μM) in one droplet source and maltose (100 mM) in the other source. The subscript n in PLn denotes the number of maltose bound to cytochrome c. (b) Normalized relative abundances of cytochrome c with different number of bound maltose (green square: PL1, red circle: PL6, blue triangle up: PL11, magenta triangle down: PL18). The normalized factor for each plot for PL1, PL6, PL11, and PL18 is ×1, ×4·7, ×11·7, and ×17·4, respectively. (c) Average number of bound maltose to cytochrome c as a function of distance x and reaction time. The axes on top of (a) and (c) show the converted reaction time from the corresponding distance.

