
Figure 2. Characterization of genomic events in a patient with fulminant metastatic progression.
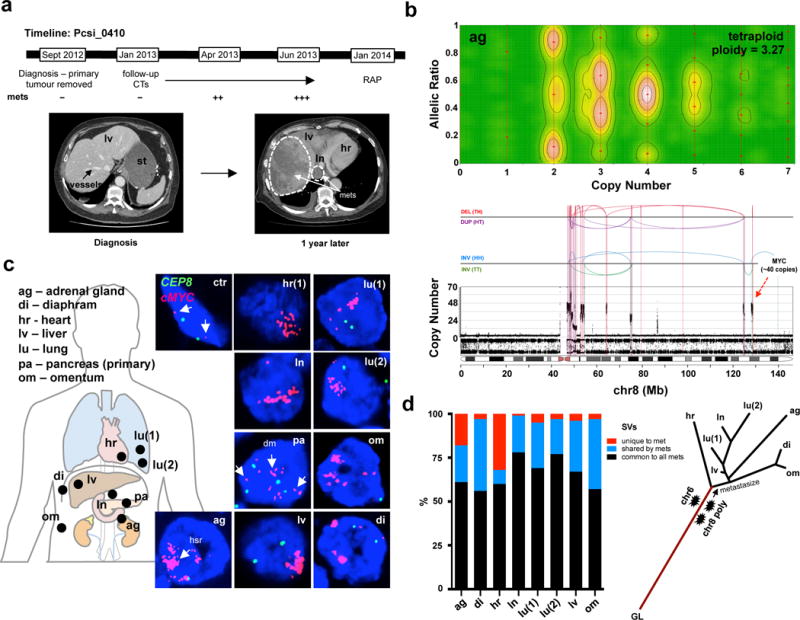
(a) Top: Progression timeline of patient Pcsi_0410. Bottom: Computerized tomography (CT) images of the abdomen at diagnosis (right) and one year later (left). No metastases are present in the liver at diagnosis. Within a year, the liver was decimated with metastases (right – white hashed line). At the rapid autopsy (RAP), 8 distinct metastases (see image in c) were harvested for sequencing. (b) Representative image of polyploidization (top) and chromothripsis (bottom) event from the adrenal gland metastasis. Analyses of all metastases are shown in Extended Data Figure 7. (c) FISH analysis c-MYC amplification in primary tumour and all metastases. Fibroblasts surrounding the tumour cells were used as a control (ctr - white arrows). Scattered nuclear staining in the primary tumour is consistent with presence of double minutes (dm – white arrow in pa). Homogenous staining areas (hsr – white arrow in ag) suggest reintegration into the genome22. (d) Proportion of SVs common to all (black), shared by two or more (blue), or unique to each metastases is shown on the left. CN and SVs were used to reconstruct radial phylogenetic tree of metastatic progression (right). The primary tumour was surgically removed one year before autopsy and fresh frozen material was not available for WGS. It is possible that branch lengths of the phylogenetic tree would vary if the primary tumour were included in this analysis. Lines are to scale with CN based clustering dendrogram presented in Supplementary Figure 15, with the exception of germline origin (GL) that is half the length.