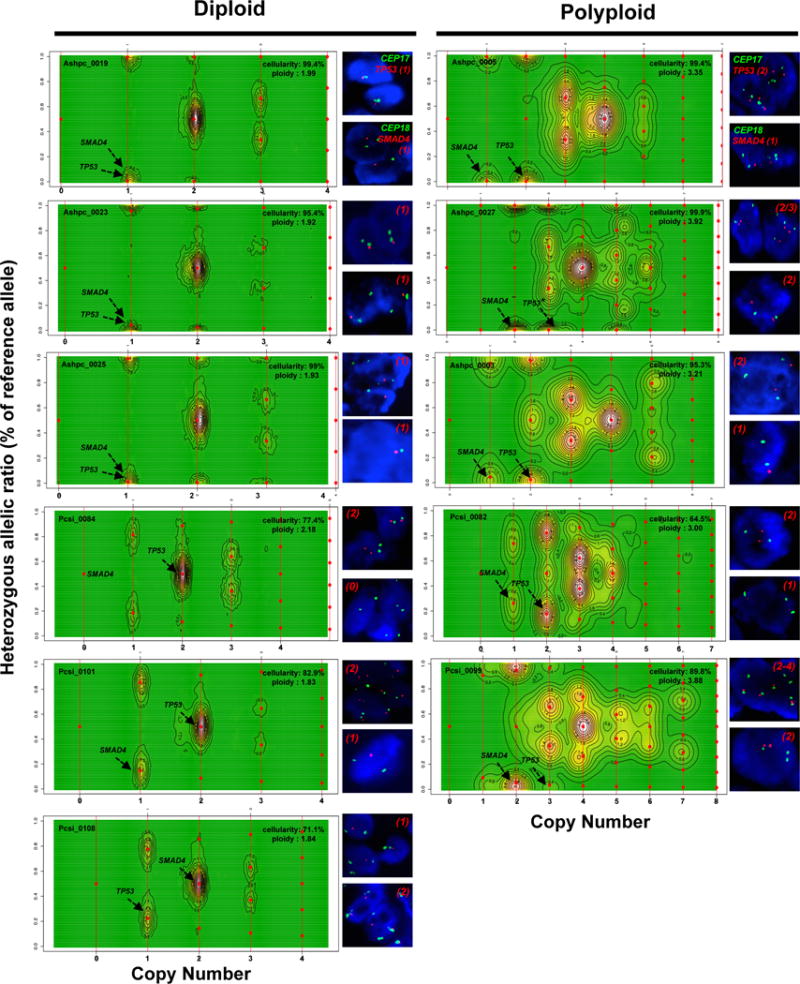
Extended Data Figure 2. CELLULOID validation.

Copy number for common alterations (TP53, SMAD4 – shown by black arrow) was derived from ploidy estimates generated by CELLULOID. Six diploid and five polyploid tumours analyzed by FISH (shown on the right of each contour plot). In all cases, CN from CELLULOID ploidy estimates were confirmed. In Pcsi_0084 (diploid), CELLULOID predicted zero copies of SMAD4. The allelic ratio in this region was 50% (heterozygous) as only reads from normal cells spanned this region. In Ashpc_0027, both CELLULOID and FISH indicate that this tumour is polyploid. The CELLULOID plot demonstrates that there is a further subclonal amplification in TP53 from polyploid clone (copy state = 3.2 derived from one allele). FISH analysis shows tumour cells with 2 or 3 copies of TP53 supporting this is subclonal. Copy number by FISH for SMAD4 (top right of each plot) and TP53 (top right of each plot) is indicated in red.
