
Figure 6.
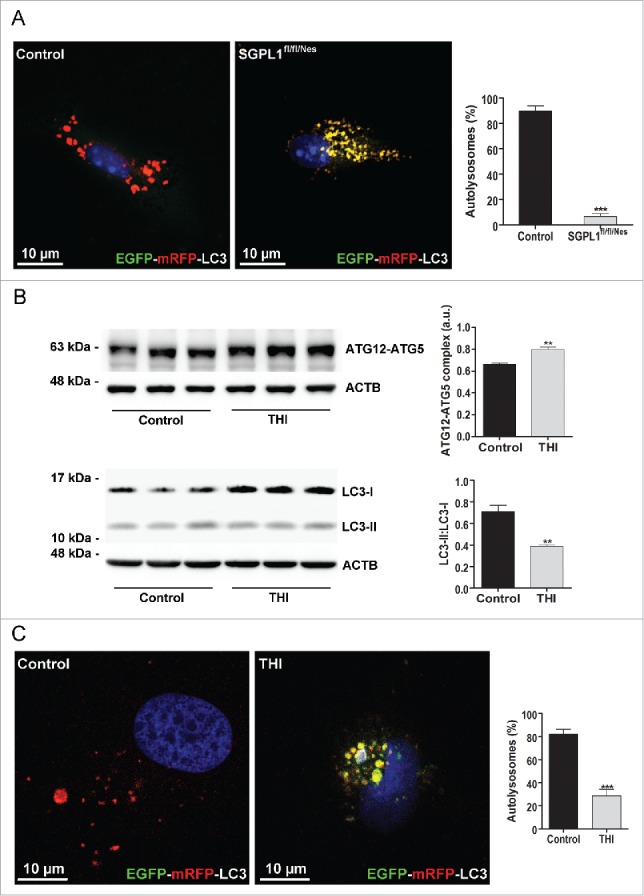
Autophagic flux is impaired in SGPL1-deficient neurons. (A and C) Images showing the fluorescence of the EGFP-mRFP-LC3 construct expressed in cultured neurons from SGPL1fl/fl/Nes and control mice (A) (unpaired Student t test, P < 0.0001) and in cultured WT hippocampal neurons treated with vehicle (control) or THI (C) (unpaired Student t test, P < 0.0001). DAPI staining indicates cell nuclei in blue. Graph shows mean ± SEM of the percentage of red structures corresponding to autolysosomes with respect to the total number of structures (red and yellow) per cell (n = 20 cells in each of 2 different cultures) (B) Representative western blot images and graphs showing mean ± SEM in extracts from cultured hippocampal neurons from WT rats treated or not with THI for the ATG12–ATG5 complex (unpaired Student t test, P = 0.0067) and for LC3 (unpaired Student t test, P = 0.0063). a.u., arbitrary units.