
Figure 7.
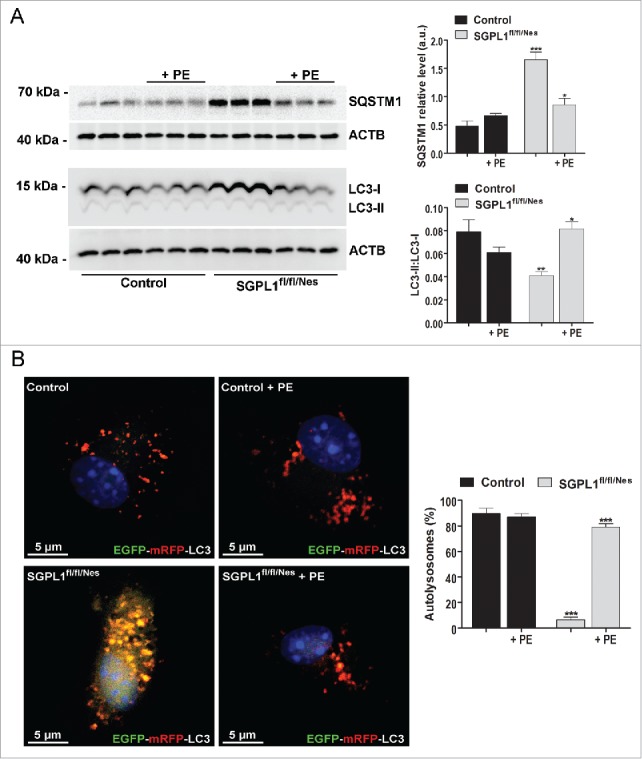
PE restores autophagic flux in SGPL1-deficient neurons. (A) Representative western blot images for SQSTM1 and LC3 and graphs showing mean ± SEM in extracts from cultured neurons generated from control and SGPL1fl/fl/Nes mice and treated or not with PE as indicated (n ≥ 3; 2-way ANOVA, PSQSTM1, genotype = 0.0001, PSQSTM1, treatment = 0.0158, PLC3, genotype = 0.0072, PLC3, treatment = 0.0293). (B) Images showing the fluorescence of the EGFP-mRFP-LC3 construct expressed in cultured neurons from control and SGPL1fl/fl/Nes mice (2-way ANOVA, P < 0.0001). DAPI staining indicates cell nuclei in blue. Graph shows mean ± SEM of the percentage of red structures corresponding to autolysosomes with respect to the total number of structures (red and yellow) per cell (n = 20 cells in each of 2 different cultures). a.u., arbitrary units.