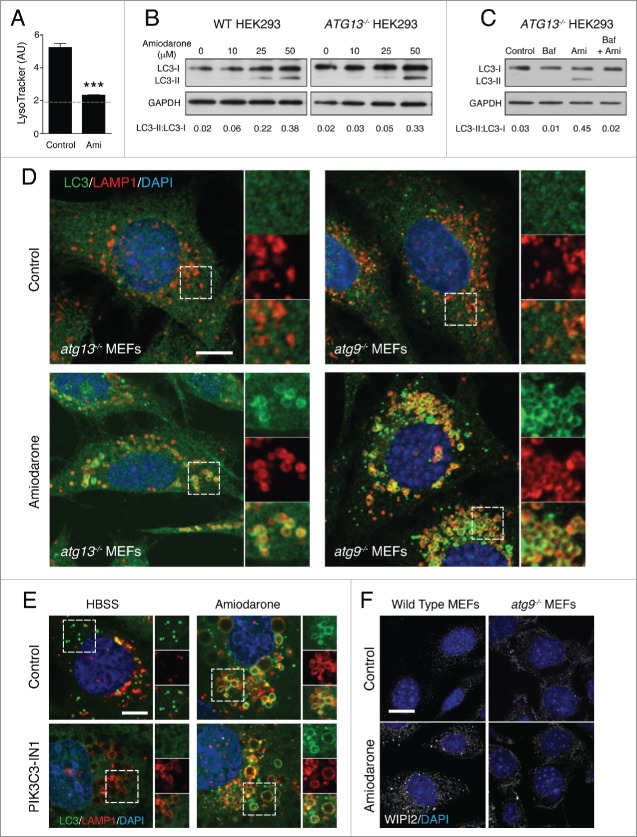
Figure 7.
Amiodarone activates noncanonical autophagy. (A) Quantification of LysoTracker fluorescence intensity in MCF10A cells treated with amiodarone (Ami, 50 μM) for 2 h. Dashed line represents background fluorescence. Levels are mean +/− standard deviation. AU, arbitrary units. (B) Representative western blots of LC3 and GAPDH in wild-type and ATG13−/− HEK293 cells treated with increasing concentrations of amiodarone. (C) ATG13−/− HEK293 cells were treated with Baf (100 nM), amiodarone (Ami, 50 μM) or Baf + Ami and lysates probed for LC3 and GAPDH. Ratios of lipidated LC3-II:nonlipidated LC3-I were quantified below. (D) Confocal images of endogenous LC3 and LAMP1 immunostaining in atg13−/− and atg9−/− MEFs treated with amiodarone (50 μM) for 2 h. Inserts show zoomed regions highlighting colocalization of LC3 and LAMP1 signals. Bar: 10 μm for all images. (E) Confocal images of GFP-LC3 and LAMP1 immunostaining in MCF10A cells starved with HBSS or treated with amiodarone (50 μM) for 2 h +/− PIK3C3 inhibitor IN-1 (5 μM) pre-treatment for 1 h. Zoomed regions highlight colocalization of LC3 and LAMP1 signals. Bar: 5 μm for all images. (F) Confocal images of WIPI2 staining in wild-type and atg9−/− MEFs treated with +/− amiodarone (50 μM) for 2 h. Bar: 20 μm for all images.

