
Figure 2.
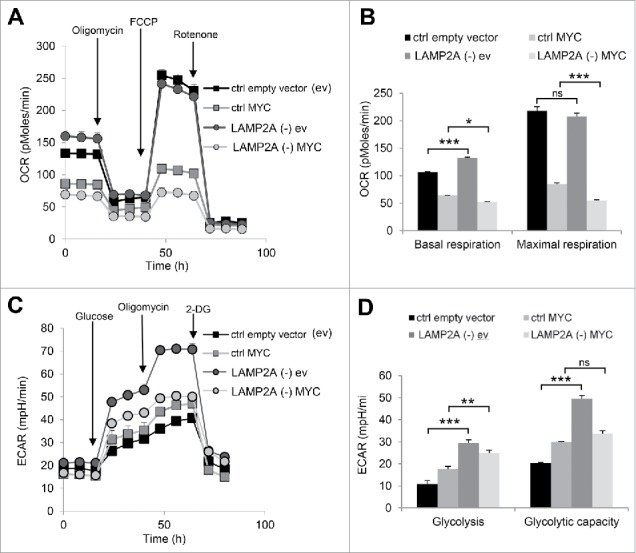
Blockage of CMA in MYC-transduced cells enhances changes in cellular metabolism associated with a transformed phenotype. (A) Seahorse Bioscience analyzer was used to measure oxygen consumption rate (OCR) in NIH-3T3 cells, control (ctrl) or LAMP2A knockdown (LAMP2A [-]), transduced with lentiviral-delivered MYC or empty vector (N = 3). (B) Quantification of basal and maximal respiration from OCR data (A). (C) A Seahorse Bioscience analyzer was used to measure extracellular acidification rate (ECAR) in the same cells as in (A) (N = 3). (D) Glycolysis and glycolytic capacity quantification form ECAR data (C). In all graphs values are presented as mean ± SEM. Two-way ANOVA and the Bonferroni post-hoc test were used and differences were considered significant for *P ≤ 0.05, **P ≤ 0.01, ***P ≤ 0.001. ns represents nonsignificant changes.