
Figure 4.
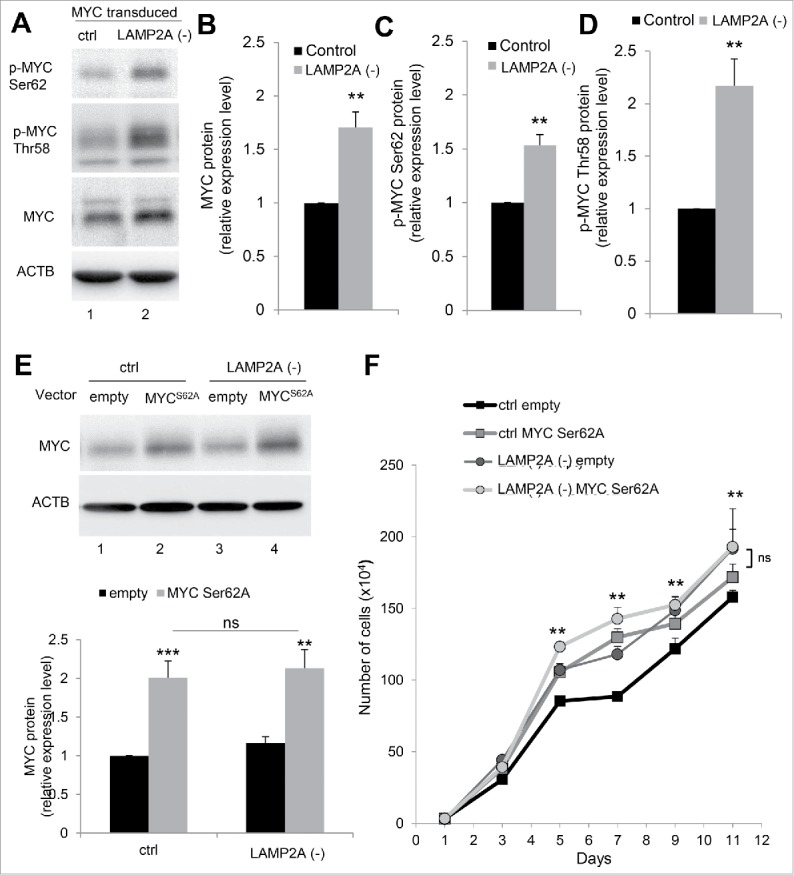
MYC phosphorylation is required for its cellular accumulation upon CMA blockage. (A) Immunoblot for the indicated proteins of NIH-3T3 MYC-transduced cells, control (ctrl) or LAMP2A knockdown (LAMP2A [-]). Densitometry quantification of total MYC (B), phospho-MYC on Ser62 (C) and Thr58 (D) in blots as the one shown in (A). Values are expressed relative to ctrl MYC-transduced cells and normalized to Ponceau S staining (N = 4). (E and F) NIH-3T3 cells, ctrl or LAMP2A (-) were transduced with a MYC mutated at the Ser62 phosphorylation site (MYCS62A). (E) Immunoblot for MYC and ACTB and quantification of total MYC in relation to ctrl empty vector cells, normalized to Ponceau S staining (N = 6). (F) Growth curve of these cells (N = 6). In all graphs values are presented as mean ± SEM. Using the Student t test (B, C, and D), as well as 2-way ANOVA and the Bonferroni post-hoc test ((E)and F), differences were calculated and considered significant for *P ≤ 0.05, **P ≤ 0.01, ***P ≤ 0.001. ns represents nonsignificant changes