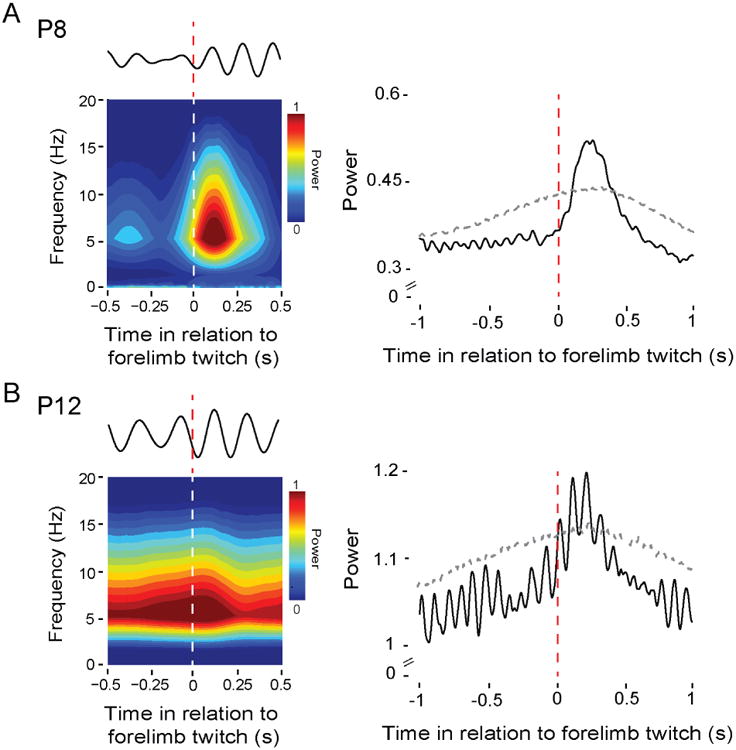
Figure 2. Myoclonic twitches trigger theta oscillations in the RN.

(A) Left: Twitch-triggered time-frequency spectrogram for a representative P8 rat (108 forelimb twitches). Above the spectrogram is a representative LFP signal (4-7 Hz) from the same pup in response to a single forelimb twitch. Right: Mean twitch-triggered LFP power (4-7 Hz, root mean square) pooled across subjects (11 pups; 2,292 forelimb twitches). Horizontal dashed line denotes upper acceptance band, p < 0.01.
(B) Left: Same as in (A) but at P12 (147 forelimb twitches). Right: Same as in (A) but at P12 (11 pups; 1,054 forelimb twitches).
