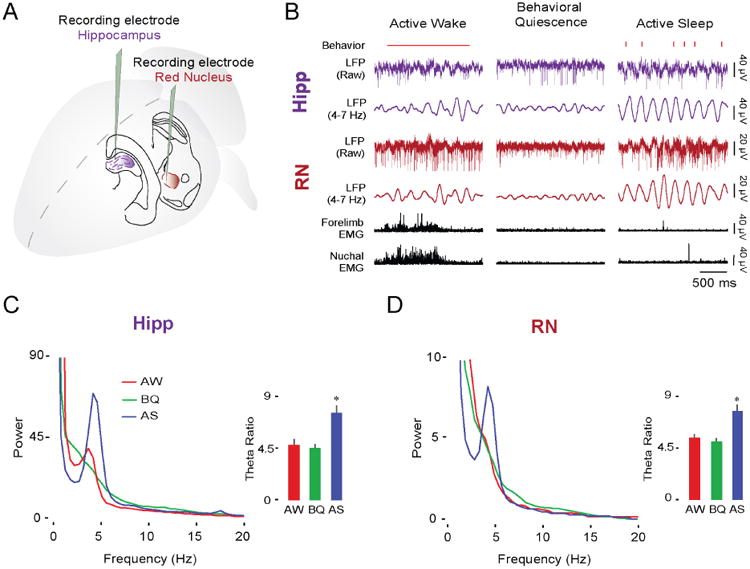
Figure 3. The hippocampus and RN exhibit similar state-dependent theta activity at P12.

(A) Illustration depicting electrode placements in the dorsal hippocampus and RN.
(B) Representative data from a P12 rat showing sleep and wake behavior (wake movements: horizontal red line; twitches: red ticks; manually scored), simultaneously recorded LFP activity in the hippocampus (purple traces) and RN (red traces), and forelimb and nuchal EMGs (black traces) across behavioral states.
(C) Mean LFP power spectra and mean (+ SE) theta ratios in the hippocampus at P12 (19 pups) during AW (red), BQ (green), and AS (blue). Asterisk denotes significant difference from other behavioral states, p < 0.001.
(D) Same as in (C) but for RN.
See also Figure S2 and Figure S4.
