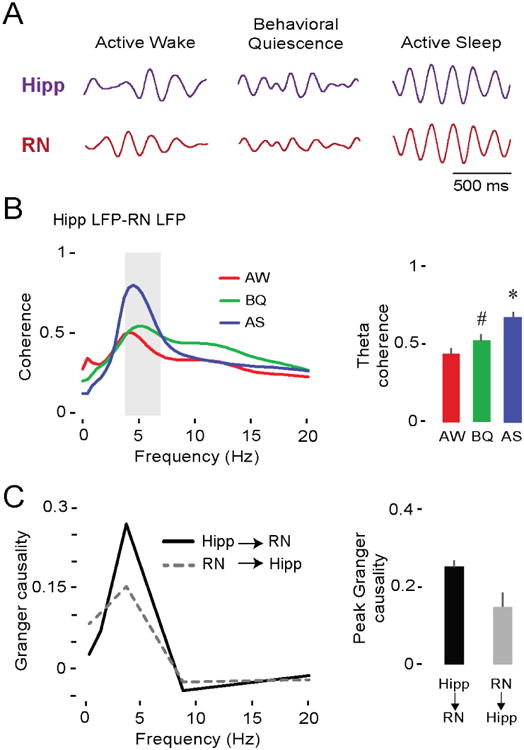
Figure 4. Theta oscillations in the hippocampus and RN at P12 are coherent and mutually interactive during AS.

(A) Representative theta-filtered LFPs (4-7 Hz) in the hippocampus (purple trace) and RN (red trace) in a P12 rat across behavioral states.
(B) Left: Mean LFP-LFP coherence spectra between hippocampus and RN (19 pups, 19 LFP pairs) during AW (red), BQ (green), and AS (blue). Shaded gray area indicates theta-frequency range. Right: Mean (+ SE) theta coherence across behavioral states. Asterisk denotes significant difference from AW and BQ, p < 0.001. Hashtag indicates significant difference from AW, p < 0.05.
(C) Left: Mean Granger causality spectra for pups exhibiting significant bidirectional interactions between hippocampus and RN (p < 0.01; 9 pups, 9 LFP pairs). Right: Mean (+ SE) peak Granger causality value within theta-frequency range (9 pups, 9 LFP pairs). See also Figure S4.
