
Figure 5. Comodulation of theta in the hippocampus and RN during AS at P12.
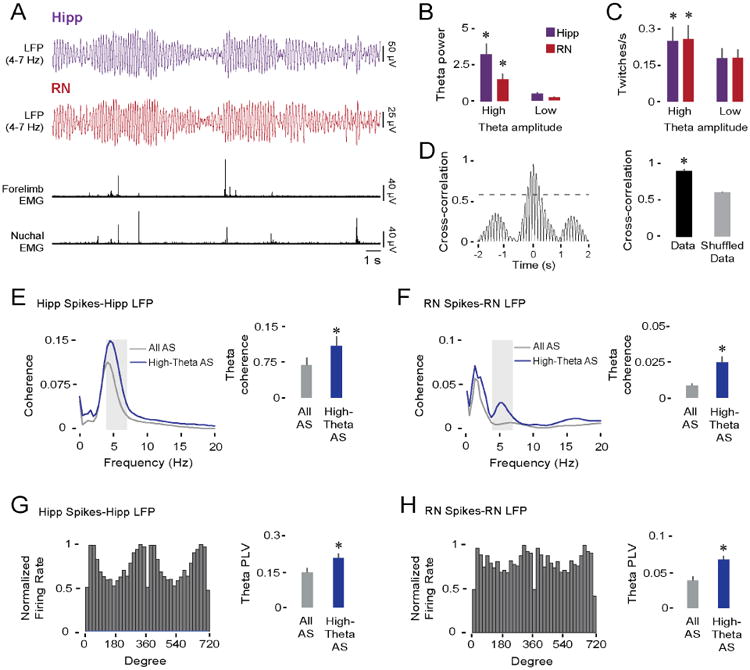
(A) Representative data in a P12 rat depicting simultaneously recorded theta-filtered LFPs (4-7 Hz) in the hippocampus (purple trace) and RN (red trace), and forelimb and nuchal EMGs (black traces).
(B) Mean (+ SE) theta power in the hippocampus (purple bars) and RN (red bars) during periods of high- and low-amplitude theta (19 pups). Asterisks denote significant difference from low-amplitude theta values, p < 0.001.
(C) Same as in (B) but for twitching rate.
(D) Left: Representative cross-correlogram between theta-filtered LFPs in the hippocampus and RN of a P12 rat. Dashed line denotes threshold for statistical significance, p < .01. Right: Mean (+ SE) LFP cross-correlation coefficients between hippocampus and RN for actual and shuffled data (19 pups, 19 LFP pairs). Asterisk denotes significant difference, p < 0.001.
(E) Left: Averaged hippocampal spike-LFP coherence spectra during entire periods of AS (gray line) and periods of AS with high-amplitude theta (blue line; 27 spike-LFP pairs). Shaded gray area indicates theta-frequency range. Right: Mean (+ SE) spike-LFP coherence within the theta-frequency range. Asterisk denotes significant difference, p < 0.004.
(F) Same as in (E) but for RN spike-LFP coherence (27 spike-LFP pairs).
(G) Left: Representative example of significant phase-locked spiking activity in the hippocampus. Right: Mean phase-locking values within the theta-frequency range during entire periods of AS (gray bar) and periods of AS with high-amplitude theta (blue bar; 27 spike-LFP pairs). Asterisk denotes significant difference, p < 0.005.
(H) Same as in (G) but for RN phase-locking (36 spike-LFP pairs).
See also Figure S1 and Figure S4.