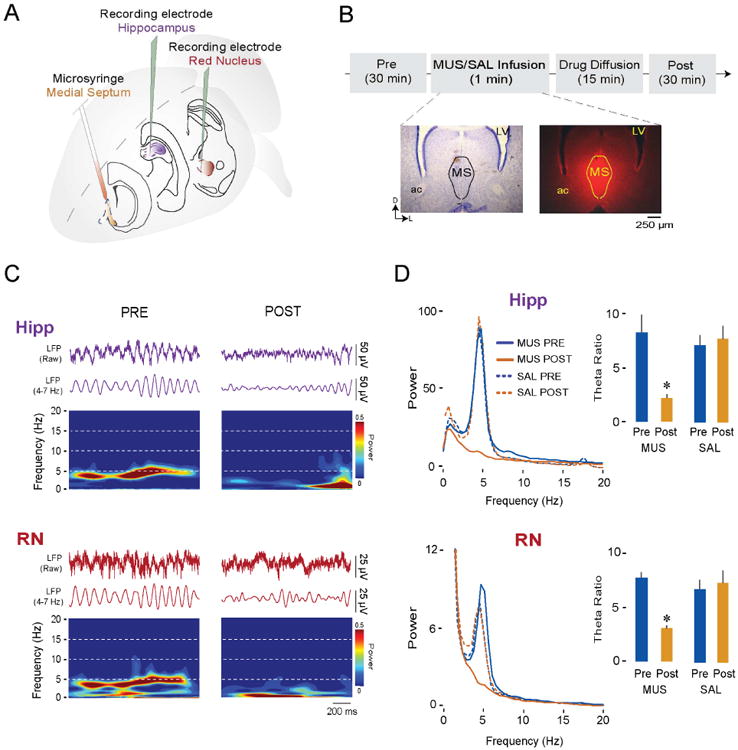
Figure 6. Pharmacological inactivation of the medial septum (MS) blocks theta oscillations in both the hippocampus and RN at P12.

(A) Illustration depicting electrode placements in the hippocampus and RN and microsyringe placement in the MS.
(B) Experimental timeline and representative coronal Nissl-stained brain section (left) and corresponding section showing diffusion of fluorescent muscimol in the MS (right). LV = lateral ventricle; ac = anterior commissure.
(C) Representative dual LFP recordings during AS in a P12 rat from the hippocampus (purple traces) and RN (red traces) and corresponding time-frequency spectrograms. (D) Left: Averaged LFP power spectra during AS in the hippocampus (top) and RN (bottom) before (Pre) and after (Post) infusion of either muscimol (MUS; 6 pups) or saline (SAL; 6 pups) into the MS. Right: Mean (+ SE) theta ratios during AS in the hippocampus (top) and RN (bottom) before and after infusion of muscimol or saline into the MS. Asterisks indicate significant difference from Pre, p < 0.02.
See also Figure S3, Figure S4, and Table S1.
