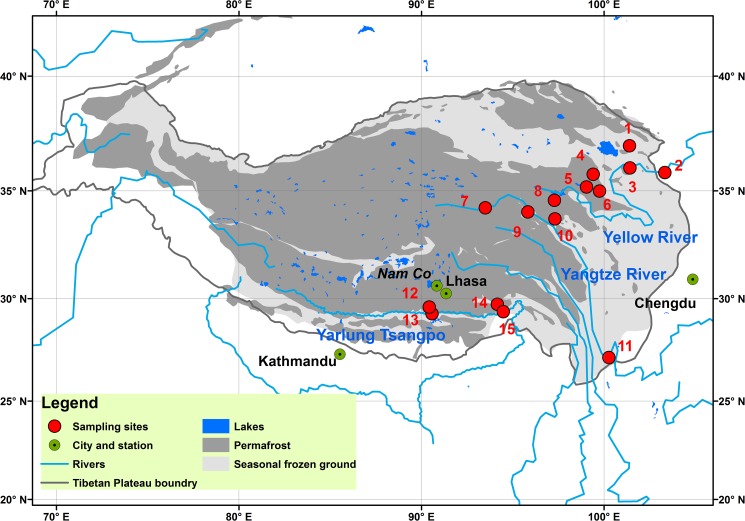
Fig 1. Permafrost distributions, locations of sampling sites and stations with precipitation data for the headwater rivers of the Tibetan Plateau.
Data of permafrost distributions were from [20]. The map was plotted by ArcGIS 10.2.1 software (ESRI®). Detailed information concerning the sampling sites is shown in Table 1.

