
Figure 2.
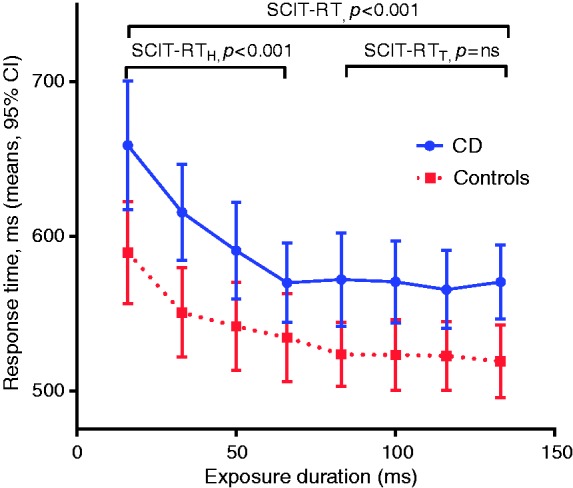
Mean response times per exposure duration (95% CI) for CD vs control groups showing significantly slower response times in the group with CD, across all exposure durations (SCIT-RT), head (SCIT-RTH), and tail responses (SCIT-RTT), each p < 0.001, one-way ANOVA test). CI: confidence interval; CD: Crohn’s disease; SCIT-RT: Subtle Cognitive Impairment test response time; ANOVA: analysis of variance.