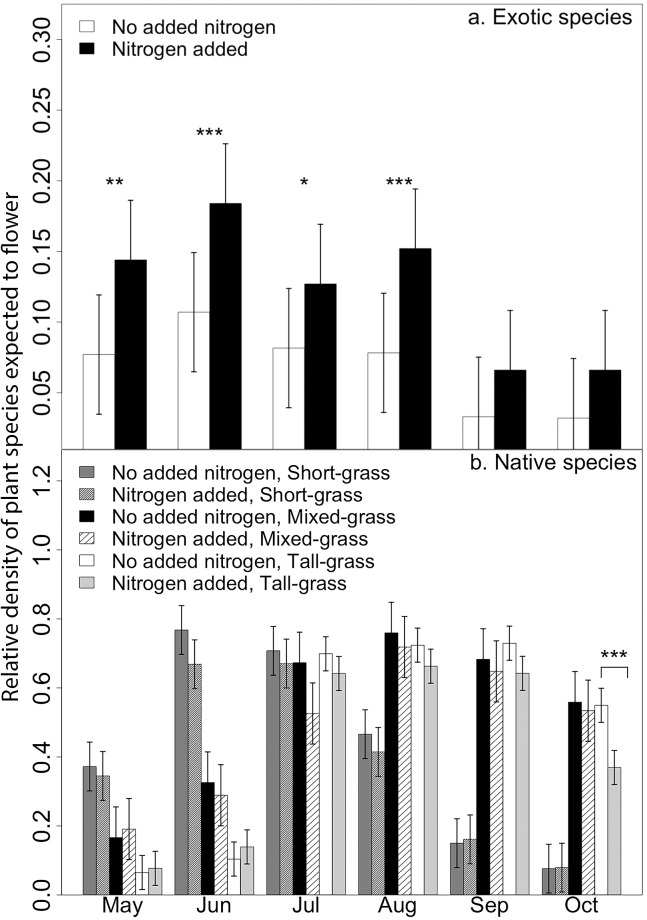
Fig 2. Flowering potential for exotic and native species.
Mean (± SE) flowering potential (FP), the relative cover of species expected to flower in each month of the growing season. Exotic species FP (top) is averaged across all prairie ecoregions, as the highest order interaction was nitrogen (N) * month. Native species FP (bottom) is separated for the tall-, mixed-, and short-grass prairies because there was an N * month * ecoregion interaction for this group. Asterisks indicate values that are statistically distinct following Bonferroni correction *** p < 0.001, ** p < 0.01, *p < 0.05.

